Evidence-based Medicine and Outcomes Analysis
An evaluation

Evidence-based medicine is fast overtaking experience-based medicine in the field of healthcare delivery. Outcomes analysis allows the assessment of the quality of care delivered and matches them against the resource costs. It is becoming increasingly imperative for the various stakeholders involved in the entire healthcare delivery process, that is, the care deliverers and clinical managers, are not only knowledgeable but also practice it on a regular and rigorous basis. This paper attempts to put both the knowledge and the practice methodologies in a simplified manner so that all the care deliverers can easily implement them in their workplaces.
A new paradigm for determining diagnosis and prognosis is evolving that is set to revolutionise the way patients are managed, thereby increasing effectiveness without compromising productivity or quality of care provided. It is called ‘practising evidence-based medicine’.
Clinical practice is changing due to rapid advances in technology and the clinicians need to change their practice methodology in order to continue to deliver high levels of specialised care. An average clinician today is faced with a multitude of problems. Ever increasing medical knowledge in the form of 27kg of guidelines, more than 3000 new papers per day, 1000 new Medline articles, 46 randomised clinical trials, and the number of biomedical journals alone doubling since 1970. Couple it with the average workload for a clinician of anything between 100 to 200 consultations a week resulting in 5000 to 10000 per year (UK figures). Add to it the difficulty in being sure that one is doing the right things for all these cases, relying solely on experience while using 2 million pieces of information all stored in one’s memory, ever increasing pressures to provide value-for-money services, raised patient demands and expectations, pressures due to a myriad of obtrusive and mostly confusing regulatory compliances, and rapidly altering business demands. It does not paint a happy picture by any stretch of the imagination.
Every encounter with a patient identifies appear more often than not to reveal some gaps in the understanding of the aetiology, diagnosis, prognosis, or therapy of their illness on the part
of most clinicians. Recent research reveals that even as seasoned clinicians generate about five knowledge ‘needs’ for every in-patient encounter, and two ‘needs’ for every three outpatient’s encounters. To bridge these gaps and fulfill the ‘needs’, it has become imperative to practice evidence-based medicine. To evaluate the best evidence and make the necessary corrections, it has become necessary to perform outcomes analysis.
Evidence-based Medicine
The most commonly accepted definition of ‘Evidence-based Medicine’ is that it is the conscientious, explicit and judicious use of current best evidence in making clinical decisions about the care of individual patients.
Dr.DavidEddy of Kaiser Permanente is widely credited for having coined the term ‘Evidence-based Medicine’. He explains that when there is evidence that something works and is good and benefits the patient, one should do it. When one has evidence that there is no benefit and that it is ineffective, where it is going to harm the patient either directly or indirectly by stealing resources, one should not do it. When there is insufficient evidence to determine either way, one must be conservative, relying on individual clinician discretion. This means the integration of individual clinical experience with the best available external clinical evidence from systematic research.
Individual clinical expertise means the proficiency and judgment that individual clinicians acquire through clinical experience and clinical practice.
Increased expertise is reflected in many ways, but especially in more effective and efficient diagnosis and in the more thoughtful identification and compassionate use of individual patients’ predicaments, rights, and preferences in making clinical decisions about their care.
Best available external clinical evidence means clinically relevant research, often from the basic sciences of medicine, but especially from patient centered clinical research into the accuracy and precision of diagnostic tests (including the clinical examination), the power of prognostic markers, and the efficacy and safety of therapeutic, rehabilitative, and preventive regimens. Such evidence validates previously accepted diagnostic tests and treatments, and where necessary, replaces them with new ones that are more powerful, more accurate, more efficacious, and safer.
Any practice that uses best evidence, while delivering healthcare, is called ‘evidence-based practice’. Such practice generally is the application of up-to-date information from relevant, valid research about the effects of different diagnostic tests and the predictive power of prognostic factors across the broad field of healthcare, including education, practice management and health economics.
 A new approach for practising evidence-based medicine is to build evidence-based balance sheets to integrate the best evidence with the possible outcomes to help in deciding the ‘right’ method of treatment for a patient. The purpose is to display this information as quantitative estimates of the effects of alternative treatments on all the important outcomes in a compact form so that all the stakeholders can make an informed choice when deciding on a treatment plan. These are especially useful for informed shared decision-making between clinicians and patients. The main strength of these balance sheets is that they summarize in one place the critical information needed to make decisions.
Evidence-based healthcare is a newer term broadening the evidence-based medicine techniques to other aspects of healthcare delivery. This is defined as the conscientious use of current best evidence in making decisions about the delivery of healthcare services. This is as defined at First Annual Nordic Workshop on how to critically appraise and use evidence in decisions about healthcare, National Institute of Public Health, Oslo, Norway, 1996.
Outcomes Analysis
Outcomes analysis is a non-prejudiced analysis of the outcome of an event, episode or encounter. It is used by the nurses as a measure for patient acuity, the hospital administrators and the health economists to perform cost-benefit analysis, and care providers to justify their clinical decisions regarding treatment plans as well as to validate the clinical protocols when followed. Not only are the outcomes of an event, but also the variances between different treatment methodologies are measured. In a clinical setting, it also allows one to find out how well a particular treatment method is faring.
The aim of outcomes analysis is not to find ways to reduce, but to put a cost on a given treatment regimen. It is entirely possible that the measure ends up recommending a treatment regimen that is costlier because it is more beneficial. It can also be used as a costing method to perform cost-benefit analysis and effort estimations.
The various parameters that are evaluated are as follows:
• Quality Adjusted Life Year (QALY)
• Patient preferences
• Resource use including time, money, equipment, hospital stay, etc.
• Nursing Acuity
• Cost effectiveness.
The Process
Evidence-based medicine converts reading and appraising the information into using it to benefit individual patients while concurrently adding to the clinician’s knowledge base. Instead of reading all the articles in a journal, it is better to focus on the ones that are related to specific problems. It is critical that one follows a constructive method of framing the pertinent question related to the problems on hand, and then searching for evidence related to that question. The aim is to keep one’s knowledge at a more usefully productive level.
Evidence-based medicine requires some knowledge regarding the calculations and interpretations of relative risks, absolute and relative risk reductions, odds ratio, numbers needed to treat/harm, sensitivity, specificity, likelihood ratio, pre-test probabilities, etc.
Outcomes analysis is an inherent requirement for the total adoption of evidence-based medicine. Without the results arrived at from analysis of outcomes being added to the knowledge repository for future reference, the internal expertise is not enriched, i.e. there is no value-add of the process for future patient with similar clinical picture demanding the answers to similar questions.
Calculations in Evidence-based Medicine
There two broad types of calculations that go into effective practice of evidence-based medicine. These are evaluating the following:
1. Evidence regarding the efficacy of a certain treatment as opposed to another, including no treatment. Mostly results from randomised clinical trials are used. It is a type of prognostic assessment
2. Evidence regarding a particular diagnostic test or patient finding. It is a type of diagnostic assessment.
For Assessment of Treatment Protocols
Absolute Risk Reduction (ARR): This is the difference in the risk of the outcome between patients who have undergone a particular method of treatment (called experimental) and those who have not undergone that method (called control). This measure tells us the percentage of patients who were spared the adverse outcome as a result of having received the experimental rather than the control therapy. It is calculated as |EER – CER|
Relative Risk (RR): This is the ratio of the risks in the experimental to the control groups and is represented as a percentage of the original risk. It is calculated as |EER – CER| / CER
Relative Risk Reduction (RRR): This is the extent to which an experimental treatment reduces a risk, in comparison with the control, and assesses the effectiveness of a treatment. This is calculated by subtracting the RR from 1. If the RRR is 0, then the experimental treatment is no different from the control. The relative risk reduction is fundamentally an estimate of the percentage of baseline risk that is removed as a result of the experimental therapy. It is calculated as |CER-EER| /CER. A risk is considered to be baseline if the risk of an adverse event among patient either in the control group or who are receiving the standard or inferior therapy.
Numbers Needed to Treat (NNT): This is the most recently introduced measure of treatment efficacy, and is defined as the number of patients who need to be treated to achieve 1 additional good outcome. It the reciprocal of the ARR, and is measured if the outcome of the experimental treatment is positive. When the outcome is negative, numbers needed to treat (NNH) is measured. This is the number of patients who need to be treated with the experimental method to cause 1 additional patient being harmed as compared to those who are treated with the control method. The thumb rule is that if EER > CER, then calculate NNT else calculate NNH. The numbers needed changes inversely in relation to the baseline risk. If the risk of an event doubles, one needs to treat only half as many patients to achieve the same results, and if the risk decreases by a factor of four, one needs to treat four times as many. It is calculated as 1 / ARR
Odds Ratio (OR): These are the odds of an event (usually adverse) occurring and are usually the measure of choice in the analysis of case-control studies. Generally, the odds ratio has certain optimal statistical properties that make it the fundamental measure of association in many types of studies. The statistical advantages become particularly important when data from several studies are combined, as in meta-analysis. Among such advantages, the comparison of risk represented by the odds ratio does not depend on whether the investigator chose to determine the risk of an event occurring (e.g. fatal) or not occurring (e.g. improvement). This is not true for relative risk where the definitions of experiment and control can alter the figures. In some situations the odds ratio and the relative risk will be close like in case control studies of a rare disease. The odds ratio is calculated by dividing the odds in the experimental group by the odds in the control group. It follows that efficacious treatments generate odds ratios that are less than 1, which is analogous to the relative risk for the adverse event (EER/CER) being less than 1.
Meta-analysis: It is a statistical procedure that integrates the results of several independent studies considered to be ‘combinable’ and should be viewed as an observational study of the evidence. Well-conducted meta-analyses allow a more objective appraisal of the evidence than traditional narrative reviews, provide a more precise estimate of a treatment effect, and may explain heterogeneity between the results of individual studies. Ill conducted meta-analyses, on the other hand, may be biased owing to exclusion of relevant studies or inclusion of inadequate studies. Methods used for meta-analysis use a weighted average of the results, in which the larger trials have more influence than the smaller ones. Results from each trial are graphically displayed, together with their confidence intervals. A black square and a horizontal line represent each study, which correspond to the point estimate and the
95 per cent confidence intervals of the odds ratio. The 95 per cent confidence intervals would contain the true underlying effect in 95 per cent of the occasions if the study were repeated again and again. A solid vertical line is drawn that corresponds to no effect of treatment (odds ratio 1.0). When the confidence interval of any study includes 1 the difference in the effect of experimental and control treatment is not significant at conventional levels (p>0.05). An area made of black squares reflects the weight of the study in the meta-analysis. A diamond shape represents the combined odds ratio, calculated using a fixed effects model, with its 95 per cent confidence interval. It should be noted here that a result that is meta-analytical in origin should be viewed with a higher degree of confidence than one that is not.
For Assessment of Findings / Diagnostic Tests
 Sensitivity: Representing the accuracy of a positive test result, this is the proportion of patients who have the target disorder and also test positive for the diagnostic test.
Specificity: Representing the accuracy of negative test result, this is the proportion of patients who do not have the target disorder and also test negative for the diagnostic test.
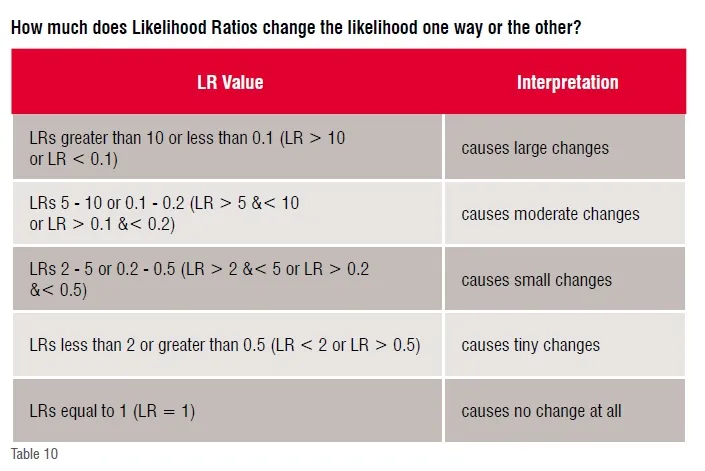
Likelihood Ratio (LR): This measures how likely the presence (or absence) of a finding (or diagnostic test) would result in ruling in (or out) a diagnosis. The ratio is used to assess how good a diagnostic test (or finding) is, to help in selecting an appropriate diagnostic test or a sequence thereof. It is better than sensitivity and specificity numbers because it is less likely to change with the prevalence of the disorder, can be calculated for several levels of signs and symptoms, can be used to combine the results of multiple diagnostic tests, and can be used to calculate the post-test probability for a target disorder. A likelihood ratio greater than 1 produces a post-test probability that is higher than the pre-test probability, while an LR lesser than 1 accomplishes the reverse, thereby altering the chances of finding the target disorder. A diagnostic test result with a very high LR (e.g. >10) would virtually rule in a disease when found positive, while one with a very low LR (e.g. <0.1) that would virtually rule out the chance that the patient has the disease.
Pre-test Probability (Priori of Bayes Rule): It is defined as the probability of the target disorder before a diagnostic test result is known. It is especially useful for (1) interpreting the results of a diagnostic test, (2) selecting one or more diagnostic tests, (3) choosing whether to start therapy without further testing (treatment threshold) or while awaiting further testing, (4) deciding whether it’s worth testing at all (test threshold). The probability of the target disorder can be calculated as the proportion of patients with the target disorder, out of all the patients with the symptoms, both those with and without the disorder.
 Post-test Probability (Posteriori of Bayes Rule): It is defined, as the probability of the target disorder being present after the diagnostic test result is known.
Bayes Rule – This is based on the theorem proposed in mid-nineteenth century by Rev. Thomas Bayes and is on probability inference. It is a means of calculating the probability that it will occur in future trials from the number of times an event has occurred.
Examples Explaining the Above
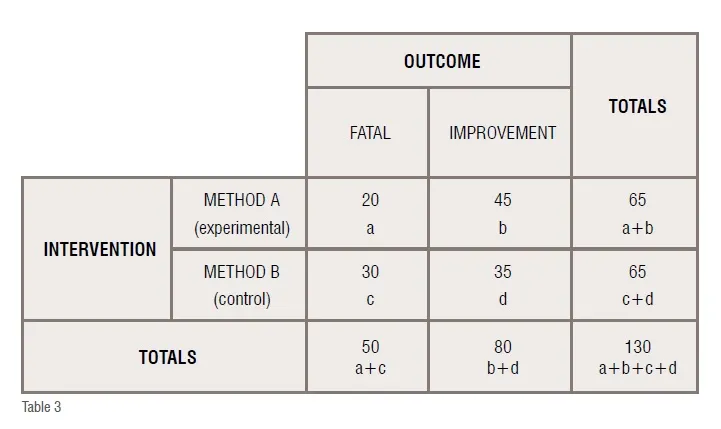
Evaluation of treatment confusion matrix for comparison of treatment methods
Randomised trial comparing treatment of condition X with method A and with method B (all numbers are fictitious).
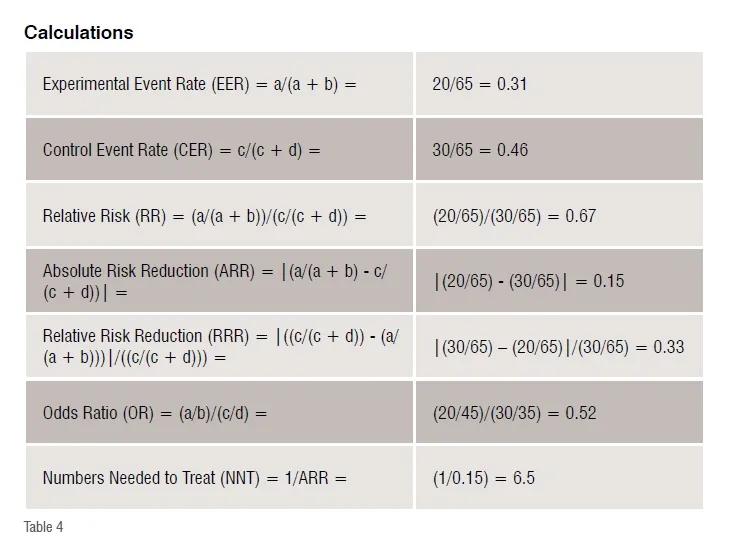
These results indicate that the risk of fatality in method A is 31per cent and in method B is 46 per cent, the relative risk of fatality after receiving treatment method A as compared to the treatment method B is 67 per cent. That is, the risk of fatality after method A is only two-thirds as that of after method B, thereby indicating that method A is better than method B. The absolute reduction of risk is 15 per cent. The relative reduction of risk is 33 per cent. The odds of fatality after method A as compared to method B is 0.52 and as it is less than 1, the treatment is considered to be effective. The numbers needed to treat is 6.5, which means that 7 more patients need to be treated to decrease the adverse outcome by 1 when method A is used instead of B.
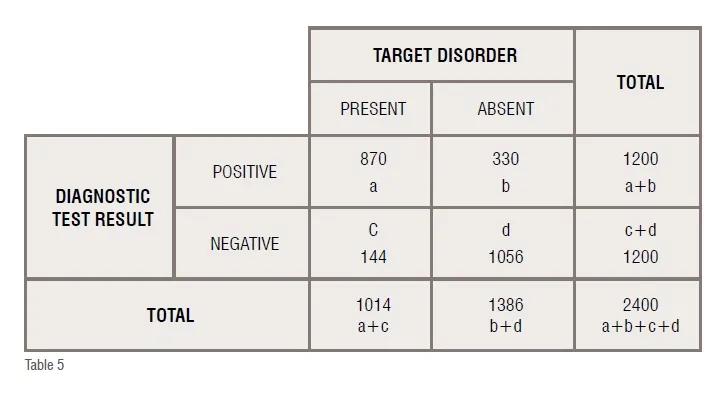
Evaluation of a Diagnostic Test
Presence of a target disorder when the diagnostic test value is positive
Suppose there is a patient with target disorder and a positive diagnostic test result. A systematic review provides the results that are summarised in the confusion matrix below (all numbers are fictitious).
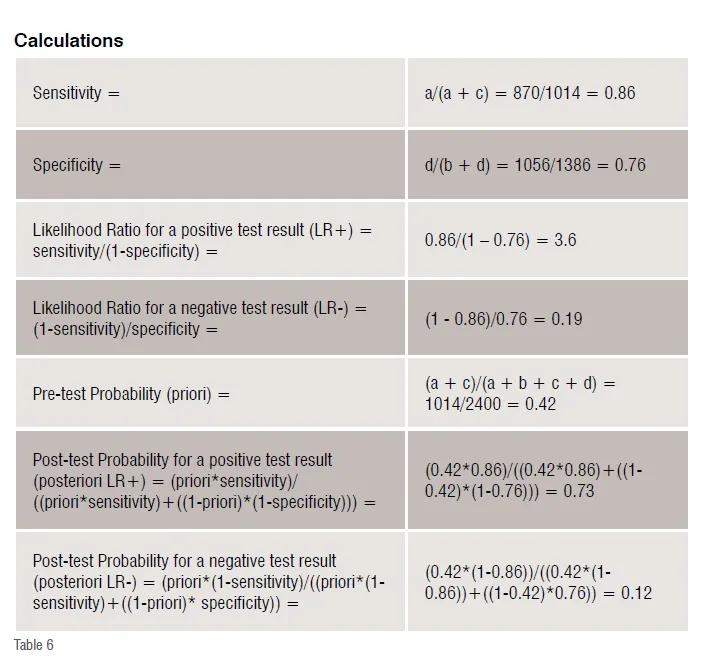
These results indicate that 86 per cent of the patients with the target disorder have a positive test result, while 76 per cent of patients who do not have the disorder test negative. The likelihood ratio of finding a positive test result is 3.6, while the likelihood ratio of finding a negative test result is 0.19. The prevalence of the disease in the study is 42 per cent. The post-test probability of finding a target disorder when the diagnostic test result is positive is 73 per cent, while that of finding it when the result is negative is 12 per cent. Since the likelihood ratio for positive test is more than 1, the post-test probability of finding the target disorder when the test is positive is more than the pre-test probability.
Important Note
Mark VanRaden opines that the p-value is able to provide good ‘hints’ regarding a hypothesis, but fails to provide any confirmation of it. It represents merely the probability of an observation being purely due to chance. Thus, a p-value 0.001 means that there is only 1/1000th possibility that the conclusion was due to chance or else, the conclusion is not by chance.
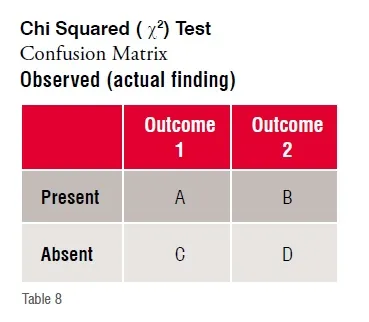
On the other hand, Chi squared tests are better, while likelihood ratio are the best indicators about a conclusion.
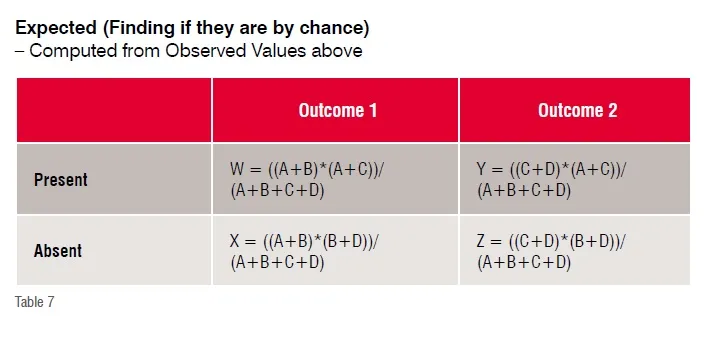
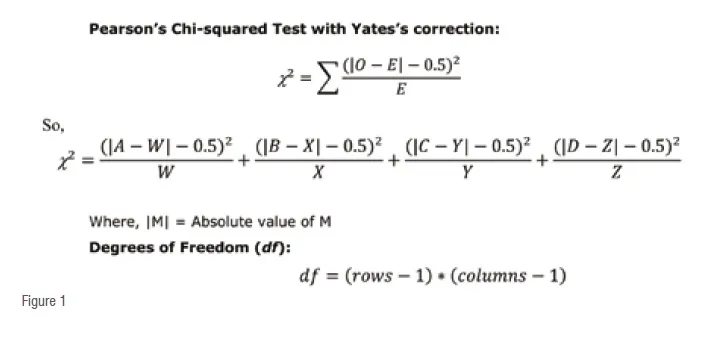
Test of Significance:
For most clinical data/observation purposes the degree of freedom (df) is always1 and ?(probability) is always 0.05 (5 per cent), the ?being the pre-determined (assumed) level of significance.
The corresponding critical value of Chi squared (|2) is 3.841 (from Chi squared critical values distribution tables). Any χ2 value above this is significant.
Interpretation:
If the calculated χ2 value is more than 3.841, the observation is a significant and NOT by a chance finding.
Conversely, when the calculated |2 value is less than or equal to3.841, the observation is an insignificant and by a chance finding.
This still is not very robust, which likelihood ratio is able to provide.
The Likelihood Ratio (LR) is a ratio of likelihoods (or probabilities) for a condition. The first is the probability that a given condition occurs (or not) in the first observation paradigm. The second is the probability that the same condition occurs (or not) in the second observation paradigm. The ratio of these 2 probabilities (or likelihoods) is the Likelihood Ratio.
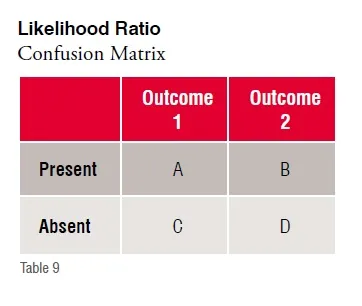
Likelihood ratio+ = sensitivity / (1 - specificity) or (A/(A + C)) / (B/(B + D))
Likelihood ratio- = (1 - sensitivity) / specificity or (C/(A + C)) / (D/(B + D))
Thus, LR is a way to incorporate the sensitivity and specificity of a test into a single measure. Since sensitivity and specificity are fixed characteristics of the test itself within the clinical sciences paradigm, the likelihood ratio is independent of the prevalence in the population.
The LR basically measures the power of a test to change the pre-test into the post-test probability of a particular outcome happening.
Thus, using likelihood ratio, it is easy to figure out whether an item like an observation (investigation) or intervention (treatment) is going to make a difference of any sort by considering the interpretation above.
Outcomes Analysis
There are two broad types of calculations that go into outcomes analysis. These are evaluating the following:
• Cost effectiveness of a particular treatment that results in a particular outcome—time, money, clinical effectiveness, patient preference. It is a type of cost-benefit analysis
• Resource utilisation in the course of a particular treatment that results in a particular outcome—time, money, clinical effectiveness, patient preference —also known as nursing acuity. It is a type of effort estimation.
• There are no formal equations for this and are usually performed on a case-by-case or departmental / institutional basis.
Discussion
Seeking an evidence base for medicine is as old as medicine itself. However, in the past decade the concept of evidence-based medicine has done a sound job in focusing explicit attention on the application of evidence from valid clinical research to actual clinical practice. Although current clinical practice is often evidence-based to an extent with new treatment methods being applied more often than not, there is still much to be gained. Important new evidence from research often takes a long time to be implemented in daily care, while established practices persist even if they have been proved to be ineffective or harmful. In the meantime, many clinicians struggle to apply the results of studies that do not seem to be that relevant to their daily practice.
Good clinicians should use both individual clinical expertise and the best available evidence from external sources. Neither alone is enough. Without clinical expertise, clinical practice risks becoming hostage to evidence and without current best evidence clinical practice risks
becoming rapidly outmoded and outdated to the detriment of overall patient care. The evidence on its own is usually not conclusive but can help in supporting the process of patient care. Adopting all of these into clinical decisions enhances the chances of maximising clinical outcomes and quality of life.
The practice of evidence-based medicine is usually triggered by patient encounters, which generate questions about the effects of therapy, utility (or futility) of diagnostic tests, prognosis of diseases, or aetiology of the underlying disorders. It requires new skill-sets of the care provider and includes efficient literature searching and application of formal rules of evidence in evaluating clinical literature, apart from the basic clinical skills of sharp observation, intelligent and logical inference from these. Careful application of intelligent and logical inference made from these is vital in justifying the practice of evidence-based medicine.
Normally a clinician uses observational studies, logical intuition, personal experience and expert opinions. Most clinical care relies on a combination of informed guesswork, unsystematic observation, common sense, the consensus views of clinical experts, and the treatment and procedures used by most other clinicians in a local community – the standard and accepted practice. An assumption is made that a traditional knowledge of physiology, pathology, and common sense is sufficient to guide clinical practice and evaluate new treatments and diagnoses. However late Archie Cochrane has stated that only 15-20 per cent of medical practice is backed up by scientifically and statistically sound research.
Evidence-based practice aims to move beyond such anecdotal clinical experiences by bridging the gap between research and the practice of medicine. The aim is to use diagnostic tests and therapeutic interventions
that are as accurate, as safe and as efficacious as possible. The clinical assessments are validated against the best evidence before they are applied to clinical care. A subsequent rigorous examination of the outcomes of different clinical actions through outcomes analysis an overall effort assessment is made to ensure the maintenance of high standards of clinical care.
The need for evidence-based healthcare arises as a direct consequence of too many patients presenting with too many problems, while the information regarding the current treatment guideline exist in too many journals.
Dr David Eddy opines that the complexity of modern medicine exceeds the inherent limitations of the unaided human mind. A rich source of new evidence for clinical care has been generated as a consequence of application of modern research methods and statistical tools, and this very abundance of evidence has made the task of practising evidence-based medicine more difficult than ever for the individual clinician.

Evidence-based medicine is here to stay and is being actively promoted by such institutions as NHS, etc. As increasing number of care providers begin to adopt and gain from this technology and better solutions that specially cater to its effective use are put in place, one can definitely look to providing improved care with lesser pain.
Concluding Remarks
It is interesting to note here that with the advent of significant computing power coupled with increasing use of EMR/EHR systems, wearable / homecare devices and mobility apps, all backed up by clinical analytics including big clinical data analytics, it is now very much feasible to process and present evidence-based figures and conclusions on-the-fly to the care providers to help them make optimal decisions regarding care delivery.
Performing evidence-based analytics using the formulae discussed above on just the data collected within an organisation can prove to be a real game-changer for many a care setting. Although the analytics are performed on a smaller data set than in a typical clinical research setting, the findings are nevertheless very relevant for that data set. With regional variations and local environmental conditions having varying degrees of impact on the disease processes, health and wellness of individuals, such information can prove to be most helpful for care provider and care receivers alike as personalised medicine can now be practiced more easily, even in the absence of genetic /genomic data.
Without doubt it can be said that changing clinical practices to evidence-based practices is no more just a dream but a very real possibility. The promise of transforming even single-doctor practices into centers of excellence cannot fail to excite even the most skeptic.
Disclaimer: Most of the material for this article has been extensively harvested from the references detailed at the end. Individual references as footnotes have deliberately been avoided to ensure ease of read and maintain continuity. The copyrights lie with their respective authors. Some web site addresses point to free online evidence-based medicine resources.
Pros and Cons
Advantages of Evidence-based Medicine
• Makes medical education more problem-centered, lifelong learning and less about memorising a static body of knowledge that is growing daily. Relying solely on memory is fast becoming an inherently inefficient method
• Functions as a tool in CME to keep up-to-date with research and to understand research techniques
• Encourages more focused and productive reading habits and data handling thereby avoiding information / cognitive over-load. One must continuously strive to avoid analysis paralysis at all costs. Much of the published material is irrelevant or of poor quality
• Improves confidence in decision-making making it easier to justify decisions to the various stakeholders in the delivery of optimised patient care
• Provides rules and rationale for group-based problem solving and teaching
• Allows quicker application of good research findings to clinical practice
• Helps in interpreting inconclusive or incomplete clinical tests results
• Emphasizes outcome (end result for patient) as well as the process (what is done by the healthcare professional)
• Allows increased patient involvement in decision-making by offering them the various odds for each of the various treatment options.
Barriers to Evidence-based Medicine
• Unrealistic patient expectations – patients demand treatment despite lack of supportive evidence for the same. (Curiously, this problem is peculiar to the GPs and not to the specialists whose words are taken more on face value)
• Constraints of time – with irritated patients crowding the waiting room on a gloomy day, the clinician’s focus needs to be the patient in front and not the journals, archives, or computers, consequently making the practice of evidence-based medicine a killjoy
• Constraints of money – access to online databases is costly. Cochrane library can be accessed by individuals from their clinics at around US$235.00 per annum fee (2003 figures). Although Medline is free, one requires a high performance PC with an ISDN or more preferably a broadband connection. The ever-dependable medical journals are quire costly
• Necessary expertise to handle the PC, if not the process. Framing the right question is the key and more often than not is missed on an otherwise busy day. Even at the best of times is not a routine walk in the park
• Requires significant investments in educating and changing the behavior patterns and habits of clinicians, many of whom view it as a threat to their autonomy – although this perception is fast changing in the areas where they are being practiced
• Poor indexing leads to frustration due to unproductive literature searches
• It is a rigorous but rigid system that seeks to restrict the functional independence of providers of patient care
• Uses the results of studies applying to populations, whereas clinicians have to deal with single patients on an individual basis. Also, the entry criteria for the studies may be so strict as to rule out most ‘real’ patients with some studies accepting only 10 per cent of the apparently eligible patients
• It demands a certain degree of knowledge of statistics that few have mastered, thereby necessitating the use of specialised solutions
• It is most effectively implemented through a comprehensive clinical information system and electronic medical record, which require substantial investments
• There is insufficient scientific evidence regarding the outcomes of many clinical interventions.
• Using Evidence-based Medicine tools, such as evidence tables, for shared decision-making with patients requires special communication tools and skills, and extra consultation time
• Few of the current health delivery systems are sufficiently integrated to facilitate the effective practice of evidence-based medicine
• It is often viewed as a form of rationing that could be used to stop clinicians using treatments of unproved efficacy even where their clinical acumen suggests it may benefit the patient.
References
1. Andre Knottnerus, Geert Jan Dinant, Associate Professor, Department of General Practice, Maastricht University, PO Box 616, 6200 MD Maastricht, The Netherlands
2. RomanJaeschke, MD; GordonGuyatt, MD; HarryShannon, PhD; StephenWalter, PhD; DeborahCook, MD; NancyHeddle, MSc. Assessing the effects of treatment: measures of association.Canadian Medical Association Journal 1995; 152: 351-357 http://homepages.pathfinder.gr/nikgabi/stat03.htm
3. Bandolier – Evidence based thinking about healthcare:http://www.jr2.ox.ac.uk/bandolier/
4. Center for Evidence Based Medicine: http://cebm.jr2.ox.ac.uk/; http://www.cebm.utoronto.ca/
5. Center for Health Evidence – Users guide to Evidence Based Medicine:http://www.cche.net/usersguides/main.asp
6. EBM: What it is and what it isn’t:http://www.minervation.com/cebm2/ebmisisnt.html
7. EPC: http://www.clinpol.mc.duke.edu/ProjectDir/EvidenceBasedMedicine/EPC/epc.html
8. Evidence Based Practice guidelines: http://www.chestnet.org/guidelines/
9. Evidence Based Practice Internet Resources:http://www-hsl.mcmaster.ca/ebm/
10. Evidence Based Practice Online: http://www.ebponline.net/
11. Evidence-based Practice Centers:http://www.ahcpr.gov/clinic/epc/
12. How evidence based balance sheet can help make decisions:http://www.kaiserpermanente.org/medicine/newsletter/balsheet.html
13. http://www.evidence-based-medicine.co.uk/What_is_series.html
14. Matthias Egger, GeorgeDaveySmith. Meta-analysis: Potentials and promise. BMJ No. 7119 Volume 315; Education and debate Saturday 22 November 1997; BMJ No. 7121 Volume 315; Education and debate Saturday 6 December 1997
15. Netting the evidence:http://www.shef.ac.uk/~scharr/ir/netting/
16. Online tutorial for effective clinical practice using clinical epidemiology:http://www.intensivecare.com/Tutorial.html
17. Practice EBM Online:http://www.infopoems.com/
18. Practicing EBM:http://www.cebm.utoronto.ca/practise/
19. Richardson WS. Evidence-based diagnosis: More is needed. Evidence-Based Medicine [EBM Notebook] 1997;2:70-1.
20. Huque M F. Experiences with meta-analysis in NDA submissions. Proceedings of the Biopharmaceutical Section of the American Statistical Association: 1988; 2:28-33.
21. AlanO’Rourke. Seminar 3: An Introduction to Evidence Based Practice.http://www.shef.ac.uk/uni/projects/wrp/sem3.html
22. Sensitivity and specificity calculations:http://www.cebm.net/sppins_snnouts.asp
23. User’s Guide to the Medical Literature.http://hiru.hiru-net.mcmaster.ca/ebm/userguid/1_intro.htm
24. What is Evidence Based Medicine (EBM)?http://www.hsl.unc.edu/lm/ebm/whatis.htm
25. JonathanBelsey and TonySnell. What is Evidence Based Medicine?http://www.evidence-based-medicine.co.uk/ebmfiles/Whatisebm.pdf
26. Jonathan Belsey, MB BS, Independent Medical Adviser, Tony Snell, MB ChB, DRCOG, MRCGP, Medical Adviser, East Kent Health, Authority. What is Evidence Based Medicine? Sponsored by an educational grant from RHÔNE-POULENC RORER. Published by Hayward Medical Communications Ltd. Copyright © 1997 Hayward Medical Communications Ltd
27. How Meaningful are P-values? Mark VanRaden, Mali Writing Workshop, 16 September, 2002

