Application of Industrial Statistical Tools in Quantitative Analysis of COVID-19 Pandemic
A Case Study of Upper-Middle-Income Country

The recent viral outbreak has affected the globe with variable degrees. The analysed case of a selected nation provided a unique approach toward studying COVID-19 progression in the selected country using well-known industrial statistical tools through the application of Statistical Process Control (SPC) software. These SPC techniques are constantly implemented in the pharmaceutical field.
Coronavirus Disease 2019 (COVID-19) pandemic is the recent viral outbreak that influenced the world during late 2019. Coronavirus influences various individuals in various manners. Most contaminated individuals will create minor to modest symptoms and get better without hospitalisation. The most noticeable manifestations of Coronavirus disease arefever, dry hack and sluggishness. On the other hand, the more uncommon side effects are a throbbing painfulness, sore throat, loose bowels, conjunctivitis, cerebral pain, loss of taste or smell, a rash on the skin, or discolouration of fingers or toes.
Despite its low mortality rates - if compared with other viral diseases such as Ebola hemorrhagic fever (EHF) - that have been reported globally, the adverse effects of this outbreak have affected the world negatively in different ways with different magnitude. One of the interesting ways to study the outbreak quantitatively in a timely manner was conducted through statistical process control (SPC) platform [1, 2]. While control charts were originally developed for monitoring and control of the industrial operations and characteristics, they have been used in the trending and tracking of the inspection properties or phenomena such as microbiological quality during environmental monitoring, water quality, surgical site infection (SSI) studyand analysis of the epidemics or pandemics [3 - 7]. The present investigation herein would provide quantitative analysis for the viral morbidities and mortalities in a selected country case as an example based on the international database record [8].Minitab® v17.1.0and CurveExpert v1.40 were used as primary statistical software for the analysis of the dataset and modelling of the cumulative recorded data, respectively [9, 10].
SPC and COVID-19 Quantitative Analysis
Reported daily cases and deaths from COVID-19 in one of the upper-middle-income countries were filtered, stratified and arranged chronologically from an Excel database [11]. Data processing was conducted using statistical programs to track the pattern and behaviour of the viral outbreak. The selected attribute chart was the Laney-modified type to correct for over or under dispersion behaviour of the record [12]. Data collection covered a specific period from 12 March 2020 till 29 July 2020 where the major excursions of the reported cases and deaths were recorded. The current process-behaviour charts in Figure 1 were unique in non-industrial monitoring for the tracking and visualisation of the outbreak incidents chronologically. Morbidities and mortalities showed sharp mountainous wave rise before the gradual ceasing of the major wave with a new relatively low stable trend with an average death rate of approximately 2.5 %. This rate is fairly low if compared with other epidemics such as Ebola Viral Disease (EVD) with mortality rates ranging from 22 % to 88 % [13]. The major causalities occurred in April followed by May with about 67 % and 77 % of cases and deaths, respectively. This evident in Figure 2 of Pareto charts. On the other hand, Figure 3 showed a three-dimensional relationship of cases and deaths as changing parameters with time. A simple yet effective and important tool to monitor the associations of two events with time as could be demonstrated in previous works [14 - 16].
Quantitative modelling of the number of emerging cases and deaths could be expressed as a daily cumulative number expressed logarithmically (Figure 4). The transformation has been used previously in the monitoring [17]. Data transformation using logarithmic transformation to the base ten could be one of the methods that modify the dispersion of the recorded dataset by minimising the scattering of the numbers. One is added to the figures to be transformed to account for zero values. While polynomial modelling might look appealing and might lead to better correlation parameters, yet it was avoided in the present case because it is characterised by bad interpolatory and extrapolatory behaviour, in addition to inferior asymptotic. The most fitted polynomial curves were found with high orders exceeding ten which would be lengthy, error-prone in calculations and impractical for frequent substitution and handling. The changing rate of cumulative COVID-19 cases could be expressed by the Exponential Association III equation: y=a.(b-e-cx) ...... Equation (1)
Coefficient Data:
a = 5.08351399579E+000
b = 1.03507457574E+000
c = 7.34343997809E-002
MMF Model: y=(a.b+c.xd)/(b+xd) ...... Equation (2)
Coefficient Data:
a = -1.37903882155E-001
b = 2.59512429190E+002
c = 3.77535874216E+000
d = 2.06153485302E+000
Where: x: is the elapsed time (in days) since the reporting of the first incidence of cases (in Exponential Association III) or deaths (in MMF) and y: is the cumulative daily cases (in Exponential Association III) or deaths (in MMF) logarithmically transformed to the base ten after the addition of ‘one’ to each total daily reported count of the affected individuals. The outbreak generally showed rapid rise in cases and deaths during short time followed by a relatively stable plateau. Thus, these two equations are mathematical expression for the major huge waves shown in the control charts of Figure 1. Nevertheless, rebound waves could not be demonstrated nor predicted from the current period of study.
Insight into the future application of quantitative risk metric in the outbreaks
The hazard magnitude of an outbreak could be assessed using a combination of several numerical factors together. The quantitative risk metric could be dependent on the integrated factors of infection rate of the herd from the total population, mortality rate and ratio from the total affected individuals, overall cases and deaths per wave of the outbreak. Accordingly, this risk is situational as it changes with time and can measure the effectiveness of the measures taken against the epidemics. Thus, it could assess quantitatively the level of improvement or deterioration not only in the same country but also between different nations as an objective comparison. The empirically derived equations for morbidities and mortalities would be useful in such instances. The analysis could follow similar path as in previous works [18, 19].
Final Conclusion
The changing pattern and spreading of the epidemic diseases generally and viral outbreaks specifically (as in the present case study) could be expressed quantitatively using numeric records for both cases and deaths as variable factors with elapsed time since the beginning of the first documented case of infection. The application of statistical tools provides and insight into the magnitude of the catastrophic events leading to an objective way of decision-making, time-saving and resource management. Moreover, a logical mean for comparison of the epidemiological events between different countries or territories would be eased. Process behaviour charts were prominently useful in the early detection of the deterioration or improvement of the inspected event allowing time for implementing precautionary measures likewise in the industry to correct the problem before any excursion could occur.
References
1. Eissa M. SPC and Evaluation of Analyst Performance | Pharma Articles [Internet]. Pharmafocusasia.com. 2020 [cited 9 August 2020]. Available from: https://www.pharmafocusasia.com/articles/spc-and-evaluation-of-analyst-performance
2. Eissa M. Pharmaceutical Component Kinetics | Inventory dynamic control is crucial | Pharma Focus Asia [Internet]. Pharmafocusasia.com. 2020 [cited 9 August 2020]. Available from: https://www.pharmafocusasia.com/articles/pharmaceutical-component-kinetics-inventory-dynamic-control-is-crucial
3. Eissa, M. Application of control charts for non-normally distributed data using statistical software program: A technical case study. World Journal of Advanced Research and Reviews. 2019; 1(1):039-48.
4. Eissa ME. Long-Term Monitoring of Giardia as an Etiological Agent for Food-Borne Outbreaks in USA: A Brief Report. Open. J. Nutr. Food. Sci. 2019;1:10-3.
5. Eissa, ME. Application of Statistical Process Controlon Analysis of Surgery-Related Infection Record: An Extended Study of Three Selected Countries Using Statistical Software, Curr Trend Pharm Res, 2019; 6(1):18-36.
6. Rashed ER, Eissa ME. Long-term monitoring of Cancer Mortality Rates in USA: A descriptive analysis using statistical process control tools. Iberoamerican Journal of Medicine. 2020 Apr 5;2(2):55-60.
7. Eissa ME. Surveillance of Cyclospora cayetanensis Epidemics in USA from Long-Term National Outbreaks Reporting System-Based Monitoring: An Observational Study Using Statistical Process Control Methodologies. Iberoamerican Journal of Medicine. 2019 Nov 21;2(1):4-9.
8. EUROPEAN DATA PORTAL. Home Open Data Portal [Internet]. The European Union Open Data Portal (EU ODP). 2020 [cited 9 August 2020]. Available from: https://data.europa.eu/euodp/en/home
9. Eissa ME, Seif M, Fares M. Assessment of purified water quality in pharmaceutical facility using six sigma tools. International Journal of Pharmaceutical Quality Assurance. 2015;6(02):54-72.
10. Mostafa Eissa M. Quality Criteria Establishment for Dissolution of Ascorbic Acid from Sustained Release Pellets. Novel Techniques in Nutrition & Food Science. 2018;2(2).
11. Overview [Internet]. World Bank. 2020 [cited 10 September 2020]. Available from: https://www.worldbank.org/en/country/turkey/overview
12. Essam Eissa M. I-MR Control Chart in Pharmaceutical Industry and the Comparison with Laney-Modified Attribute Chart: Case Study | Pharma Articles [Internet]. Pharmafocusasia.com. 2019 [cited 10 September 2020]. Available from: https://www.pharmafocusasia.com/articles/i-mr-control-chart-in-pharmaceutical-industry-and-the-comparison-with-laney-modified-attribute-chart
13. ISGLOBAL'S POLICY TEAM. ISGlobal - Ebola: Two Years and 11,300 Deaths Later [Internet]. ISGlobal. 2018 [cited 18 September 2020]. Available from: https://www.isglobal.org/en/ebola#:~:text=In%20the%20more%20than%20a,patients%20and%20along%20the%20outbreak.
14. Eissa M. Avian schistosomes impact on public health: a long-term disease observation. Annals of Medical Research. 2019; 26(8):1723-7.
15. Eissa ME. Global Health Quality Assessment Using Statistical Control Monitoring Tools Based on WHO Database Record: A Descriptive Analysis. 2019; 3(3):8-18.
16. Eissa M. Prioritisation of Raw Materials in Healthcare Industry [Internet]. Pharmafocusasia.com. 2020 [cited 10 September 2020]. Available from: https://www.pharmafocusasia.com/articles/prioritisation-of-raw-materials-in-healthcare-industry
17. Ahmed Mostafa Eissa ME, Mahmoud AM, Nouby AS. Control Chart in Microbiological Cleaning Efficacy of Pharmaceutical Facility. Dhaka University Journal of Pharmaceutical Sciences. 2015;14(2):133-8.
18. EissaMEAM. The use failure mode and effects Analysis as Quantitative Risk Analysis Tool. Opinion J App Sci Redelve: RD-APS. 2019;10009.
19. Eissa ME. Integration Between Risk Assessment and Simulation Programs to Optimize the Evaluation of Microbiological Quality and Safety in Food Industry. J Food Chem Technol. 2018 Sep 3;4(3):63-4.

Figure 1: Process-behaviour charts of chronological trend of daily cases and deaths from COVID-19 outbreak in a Western Asia country.
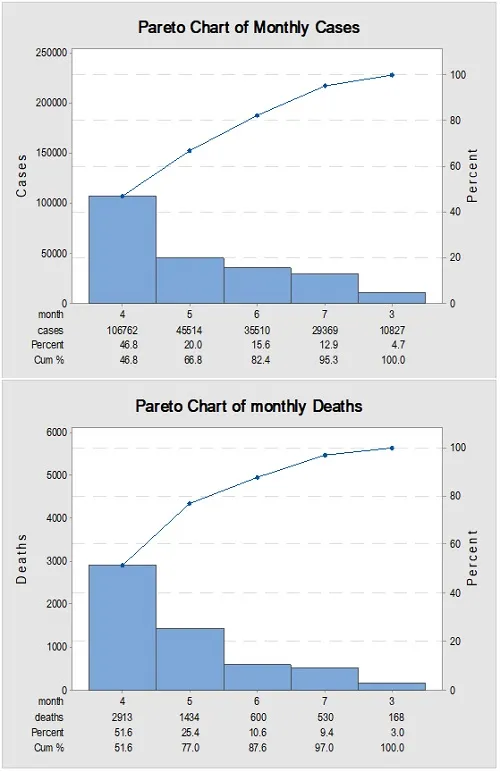
Figure 2: Pareto diagram showing monthly cases and deaths of COVID-19 in a selected country.

Figure 3: Diagrams demonstrating variations in cases and deaths as a factor of time expressed as contour plot and 3-dimentional scatter diagram with monthly sub- grouping.
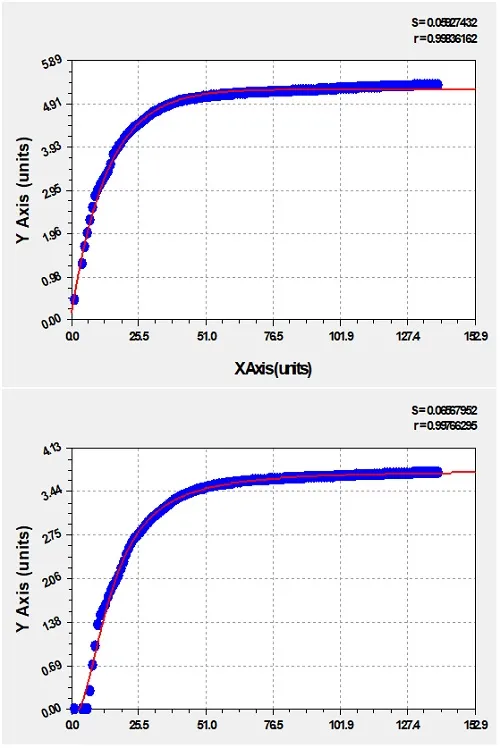
Figure 4: The cumulative COVID-19 cases (upper) and deaths (lower) expressed as logarithmic (value + 1) to the base ten on the Y-axis against elapsed time on X-axis.