


1. Introduction
Traditional dogma regarding the autonomic control of cardiac function suggests that the heart is reciprocally regulated by the sympathetic and parasympathetic divisions of the autonomic nervous system (ANS), directly under the influence of the central nervous system. At the level of the heart, the regulation is done through the intrinsic cardiac nervous system. New techniques of neuromodulation of the ANS are being developed, and it seems interesting to measure their effects. This can be done by analyzing the heart rate variability (HRV). Several methods can be used to analyse the information contained in the succession of heartbeats, which can be considered as a time series. We propose to review these methods.
2. Statistical methods
Statistical methods, also called temporal, are the most obvious to use. The calculations are based on the NN complexes. The basic parameters of the HRV are estimated by the SDNN, which is the calculation of the standard deviation of the sequence of sinus intervals measured by the NN distance during a certain period. The SDNN reflects the entirety of the components responsible for HRV during the recording period. Sinus intervals should be clearly differentiated from premature intervals because the existence of premature beats distorts the results of calculations, especially if they are numerous (more than 1 per cent). HRV results in ANS assessments may be biased if HRV is analysed without eliminating ectopic beats. Interpolation is the recommended correction method. It consists of replacing abnormal RR intervals with an interpolated RR interval. Interpolation methods include zero order, first order, spline, and nonlinear predictive interpolation. SDANN is the standard deviation of the average NN interval calculated over short periods of time, usually 5 minutes. RMSSD (root mean square of successive differences) and pNN50 (percentage of consecutive normal sinus RR intervals greater than 50 ms) allow estimation of vagal tone.
3. Spectral analysis
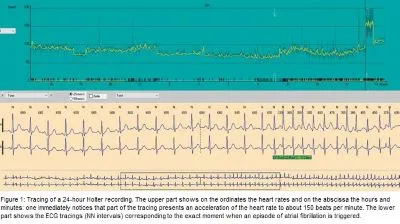
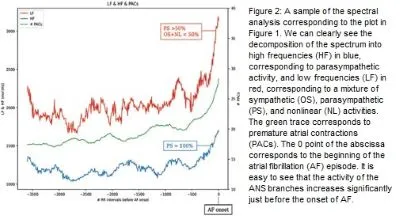
Additional information contained in the sequence of RR intervals can be extracted using spectral methods. The transformation of time into frequencies allows to infer the evolution of the parasympathetic (vagal) and ortho-sympathetic (adrenergic) branches of the ANS and to analyse their participation in the triggering of some cardiac rhythm disorders (Figure 1 and 2). The first use of the frequency spectrum corresponding to the oscillations of cardiac control systems was made by Sayers in a pioneering work performed to quantify the physiological origins of HRV. He showed that sinus rhythm responds to both linear and nonlinear laws and that the three main influences were the respiratory rate, blood pressure and temperature variations.
One of the keys to understanding ANS activity is the greater speed of vagal activity (on the order of 500 msec, which allows it to exert beat-to-beat control) compared to adrenergic reactivity (on the order of several seconds).
a. Spectral bands from 0.04 to 0.40 Hz
The HF and LF bands form the largest part of the signal for short recording times (of the order of a few minutes). Frequencies above 0.04 Hz are mainly due to sympathetic or parasympathetic control mechanisms.
i. The LF band: 0.04-0.15 Hz
The LF band represents at least part of the adrenergic activity. It is related to the baroreceptor reflex. Thus, a portion of the LFs comes from vagal activity because this reflex is mediated by the vagus nerve. The vagal or adrenergic contribution to the LF band is highly variable depending on the position and activity of the subjects. Interpretation of LFs as solely representative of adrenergic activity should be avoided.
ii. The HF band: 0.15-0.40Hz
Because the sympathetic system is relatively slow, it cannot generate significant fluctuations at frequencies above 0.15-0.20Hz, and therefore all neural contributions to the HR spectra at higher frequencies are essentially parasympathetic in origin. The HF band represents respiratory-related vagal activity, as most authors agree.
iii. The LF/HF ratio
Because of the complexity of the relationship between the vagus nerve and the adrenergic system, it is hazardous to draw conclusions from this ratio alone. The terms "autonomic modulations" and "responsiveness of the ANS to various influences" should be used instead.
b. The VLF band: 0.003-0.04 Hz
The meaning of VLFs is not clear: these frequencies could correspond to slower influencing rhythms such as hormonal rhythms and thermoregulation. It could also be aliasing and artefacts due to non-stationarity of the signal over longer periods.
c. The VHF band: (0.4-0.9Hz)
The literature concerning the very high frequency (VHF) of 0.4-0.9Hz in HRV is scarce. After heart transplantation the new sinus node is completely denervated and marked VHF peaks can be observed.
4. HR turbulence (HRT)
The turbulence phenomenon is a biphasic baroreflex-mediated HR response manifested by changes in HR in response to ventricular premature beats. It is quantified by two indices: turbulence onset, reflecting the initial HR acceleration after a premature ventricular beat, and turbulence slope, corresponding to the subsequent HR deceleration. At least 5 ventricular premature beats are required to calculate turbulence. Unlike HRV, which shows autonomic activity during sinus rhythm, HRT reflects autonomic responses to endogenous interference.
5. Deceleration capacity: phase-rectified signal averaging algorithm
It is possible to overcome the problem of non-stationarity of long duration ECG recordings by averaging phase-rectified signals (PRSA for Bivariate phase-rectified signal averaging). This algorithm allows separate characterisation of HR deceleration and acceleration over long recording times.
6. Non-linear methods
The sequence of heartbeats can be considered a dynamic system that responds to linear and nonlinear laws. Although non-linear methods have contributed to the technical understanding of the characteristics of the HRV signal, their success in developing new clinical tools remains very limited. These methods are based on the demonstration that the heart rhythm exhibits deterministic chaotic behaviour.
a. High Order Spectra (HOS)
The bispectrum provides information on the phase relationships between frequencies. Higher order spectra (HOS) can be defined for deterministic signals but also for random processes. They can identify nonlinear systems. Their main interest lies in their ability to extract information not revealed by spectral methods. Their added clinical value has not yet been demonstrated.
b. ECG and RR intervals series considered as non-linear dynamic systems.
The term dynamic simply refers to phenomena that evolve over time. The succession of heartbeats presents a temporal evolution and as such, follows the laws of dynamic, deterministic, non-linear systems. There are many indicators that allow us to assess the evolution and fluctuations of the heart rhythm. The entropy measures the rate of generation of new information. Detrended fluctuation analysis quantifies the short-term fractal properties of NN intervals. The Lyapunov exponent gives an idea about the predictability span of the events.
c. Linear and non-linear dynamics of ECG RR intervals sequences analysis by geometric methods
The main advantage of geometric methods is their relative insensitivity to the analytical quality of the series of intervals between heartbeats. Their implementation in an algorithm is easy and they have a low algorithmic complexity.
i. First return maps
Those maps are indifferently called Lorenz or Poincaré plots, first return maps, recurrence graphs. They are scatter plots showing the R-R intervals as a function of the previous R-R intervals. Their use has been suggested as a simple way to visualize HRV. These graphs allow the visualization of the global aspect of the rhythm, and their automatic recognition is likely to be used to facilitate the analysis of big data of ECG recordings acquired by mobile health applications.
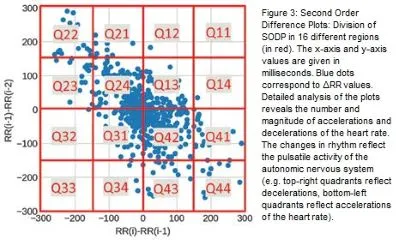
ii. Higher order difference plots
The interval variation diagram second order difference plot (SODP) is constituted by the differences of the RRs compared to the previous differences (Figure 3). The different number of points in the four quadrants clearly shows that there is a heartbeat dynamic that escapes traditional spectral analysis. SODPs can selectively measure parasympathetic activity over short duration of recordings, a difference from the PRSA algorithm which measures parasympathetic activity over longer periods of time on the order of 24 hours.
7. Conclusions
All HRV measurements essentially reflect the modulations of the vagus nerve modified by the impulses of the adrenergic system. Measurements performed over long periods provide information on individual basal autonomic status. Spectral measurements performed over short periods (usually 5 minutes) provide information on the dynamics of systems that disrupt this basal balance and may be part of the triggers of arrhythmias. Graphical methods will play an important role in e-cardiology networks, such as first return maps and difference plots, which allow rapid screening for AF. Although mathematical and computational techniques make it possible to manipulate the ECG signal to extract information and use it in predictive models, their explanatory power remains elusive. Inferences about ANS activity from these models must remain cautious.

